
Chemicals Industry Today
Natural Gas Prices Rise Across Key Regions in 2025 – Trend Report Insights
Global Natural Gas Prices in 2025 showed significant regional divergence as supply conditions, LNG flows, geopolitical tensions, and seasonal demand influenced overall movement. According to the latest Natural Gas Price Trend Report, Q3 price levels across the USA, China, Saudi Arabia, Germany, and India reflected shifting consumption patterns and evolving output dynamics. With companies and investors closely monitoring the Natural Gas price index, chart trends, and forecast models, this update provides a data-backed view of current and upcoming pricing developments.
Natural Gas Price Trend Analysis
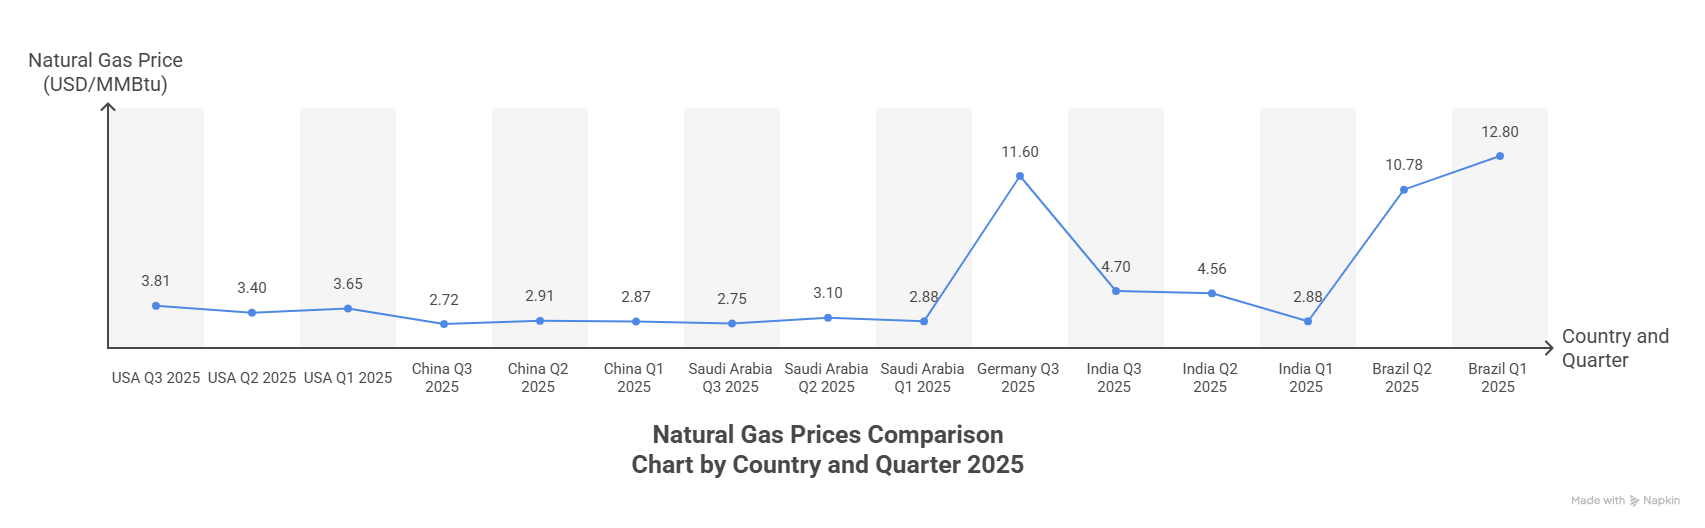
During the third quarter of 2025, Natural Gas Prices demonstrated varying momentum across major regions. The USA settled at USD 3.81/MMBtu due to balanced domestic production and stronger summer demand. China reached USD 2.72/MMBtu as LNG imports stabilized. Saudi Arabia reported USD 2.75/MMBtu under consistent output conditions. Germany recorded USD 11.6/MMBtu amid supply constraints, while India reached USD 4.70/MMBtu driven by industrial requirements and rising consumption.
Natural Gas Price Forecast 2025
Forecast models suggest Natural Gas Prices may witness moderate fluctuations through late 2025, influenced by global LNG trade patterns, storage capacity, and energy transition momentum. Stable production in the U.S. and Middle East may help maintain balanced pricing, while Europe could continue experiencing elevated values. Long-term outlooks project steady growth as renewable integration reshapes demand profiles. The Natural Gas price index remains essential for forecasting short-term volatility.
Natural Gas Price Chart & Index
The 2025 Natural Gas price chart illustrates volatility in Europe compared to relative steadiness in Asia and North America. The Natural Gas price index highlights price resilience in high-demand regions and sharper swings where supply disruptions persist.
Users can track real-time charts, indexes, and forecast updates at:👉 https://www.imarcgroup.com/natural-gas-pricing-report/requestsample
Natural Gas Price Historical Analysis Data
A review of Natural Gas price history shows strong connections between weather patterns, industrial output, and LNG shipping dynamics. Europe has historically recorded higher price averages due to import dependency. Meanwhile, supply-rich regions often maintain stable long-term pricing. Historical data from 2021–2024 points toward rising global competition for LNG volumes and increased sensitivity to geopolitical events.
What Factors Determine the Price of Natural Gas?
Key contributors shaping Natural Gas Prices include:
- Domestic production levels and storage capacity
- LNG import/export demand
- Weather variability and seasonal consumption
- Pipeline infrastructure and geopolitical tensions
- Industrial demand from power, fertilizers, and manufacturing
- Global crude oil price movements
These factors collectively determine the price of Natural Gas across different economies.
What Changed in 2025?
In 2025, renewed LNG contracts, storage optimization strategies, and shifts in European supply routes influenced regional pricing. Asia saw improved LNG inflows, while Middle Eastern supply held firm. Germany continued to face elevated costs, reflecting infrastructure constraints and higher import reliance. These dynamics shaped the Natural Gas price today across key markets.
What This Means for Investors / Consumers
For investors, the evolving landscape of Natural Gas Prices presents opportunities in LNG logistics, storage technology, and renewable-linked gas systems. Consumers and industries depend on price forecasting to plan energy budgets and procurement cycles. Monitoring the Natural Gas price index supports long-term contract structuring and risk mitigation.
Top Natural Gas Suppliers Across Regions
- QatarEnergy
- Gazprom
- Chevron
- ExxonMobil
- Saudi Aramco
- BP
- Shell LNG
- Petronet LNG
- CNPC
- These producers significantly influence supply dynamics and global price movement.
Factors Influencing Natural Gas Prices
The most impactful factors include LNG freight rates, production outages, refinery activity, storage reports, government regulations, and the pace of renewable energy integration. Industrial consumption trends in petrochemicals and fertilizers also shape Natural Gas Prices across global hubs.
Regional Price Trends Variations
North America maintained moderate pricing due to abundant shale output. China and Saudi Arabia saw competitive price levels supported by secure supply chains. Germany faced elevated costs tied to LNG import dependency. India experienced price increases reflecting growing industrial energy demand.
Browse Here Fore More Other Realed Reports:
- LPG Price Trend Report
- Hydrogen Price Trend Report
- Crude Oil Price Trend Report
- Diesel Price Trend Report
Specific Future Trends and Outlooks
Short Term
Short-term pricing may fluctuate based on winter demand, storage levels, and geopolitical developments affecting LNG routes.
Long Term
Long-term trends indicate stable growth as gas plays a bridging role in global decarbonization. Countries investing in LNG terminals and pipeline diversification may experience greater pricing stability, supporting steady Natural Gas Prices into the late 2020s.
Key Highlights of the 2025 Natural Gas Price Trend
- Q3 prices increased across most regions except China
- Europe remained the highest-priced gas region
- U.S. prices stayed relatively stable due to strong domestic production
- India experienced moderate price growth on rising industrial usage
- LNG trade adjustments shaped quarterly volatility
News & Recent Development
Recent industry developments include new LNG terminal expansions, updated gas agreements in Asia, advances in renewable-gas blending technologies, and investments in hydrogen-compatible infrastructure. These updates could reshape global supply flows and influence future Natural Gas Prices.
Quarter-on-Quarter Comparison of Natural Gas Prices in 2025
Natural Gas Prices showed fluctuating patterns from Q1 to Q3, with notable increases in the USA and India. China and Saudi Arabia experienced mild variations, while Europe and Brazil previously faced significant volatility. Overall, 2025 displayed a mixed pricing landscape driven by supply shifts and seasonal demand.
About Us:
IMARC Group is a global management consulting firm that provides a comprehensive suite of services to support market entry and expansion efforts. The company offers detailed market assessments, feasibility studies, regulatory approvals and licensing support, and pricing analysis, including spot pricing and regional price trends. Its expertise spans demand-supply analysis alongside regional insights covering Asia-Pacific, Europe, North America, Latin America, and the Middle East and Africa. IMARC also specializes in competitive landscape evaluations, profiling key market players, and conducting research into market drivers, restraints, and opportunities. IMARC’s data-driven approach helps businesses navigate complex markets with precision and confidence.
Contact Us:
IMARC Group
134 N 4th St. Brooklyn, NY 11249, USA
Email: sales[@]imarcgroup.com
Tel No:(D) +91 120 433 0800
United States: +1-201971-6302
Share on Social Media


Contact Information
IMARC Group
134 N 4th St.
Brooklyn
New York
11249
+1-201-971-6302
https://www.imarcgroup.com
Other Industry News
Ready to start publishing
Sign Up today!


